Releases in Q4 of 2024 have hit my web-dev sweet spot & it feels like a great time for a big overhaul. Join me in this experience by starting a new project!
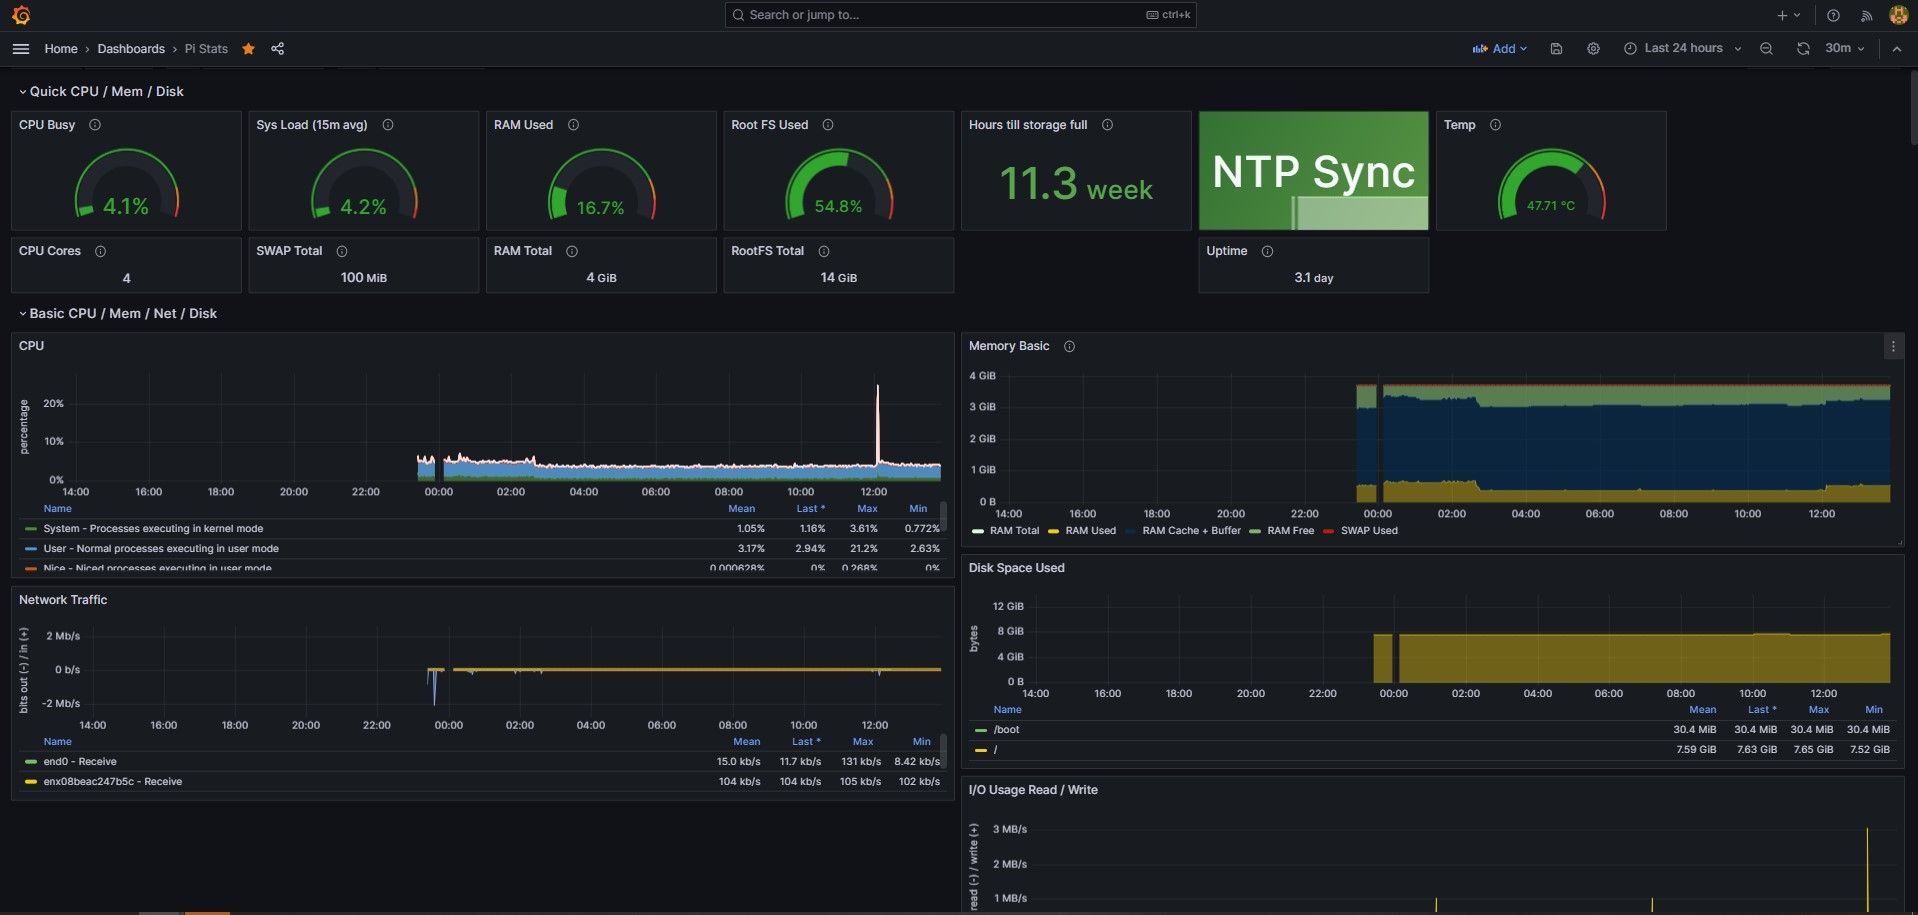
A short summary on installation, first run & securing of Prometheus & Grafana monitoring stack
A short summary on configuring Prometheus for network monitoring
Home
Blog
Tools